
Book and dictionary selection
I’ve chosen to analyze “The Tartar Steppe” by Dino Buzzati, which is my favorite novel. The main theme of the novel is the flee of time, and it is a recommended read for everyone who is struggling with a routine. The original text is in Italian, but I was able to easily find online the English version of the book in a .txt. (LINK)
For sentiment analysis, I selected a dictionary coming from the ANEW study. (LINK)
Pre-processing
For both the book and the dictionary, I manually removed a few lines of text from the head of the documents, since they were not related to the actual content.
The first step to analyze the book is to load the text in a lowercase form and remove all of the unwanted characters. To do that, I selecte a list of characters that I want to keep and I remove all of the others.
import spacy
nlp=spacy.load('en_core_web_sm')
from spacy.lang.en.stop_words import STOP_WORDS
import numpy as np
import matplotlib.pyplot as plt
#Load text and create a list of non-word characters and a text of only lowercase words
text = open('tartarsteppe.txt', 'r').read()
text = str.lower(text)
letters = "abcdefghijklmnopqrstuvwxyz "
non_word=text
for i in non_word:
    if i in letters:
        non_word = non_word.replace(i, "")
non_word=list(set(non_word))
for i in text:
    if i in non_word:
        text = text.replace(i, " ")
I proceed to tokenize and lemmatize the text using the spaCy library; after that, I remove all the stopwords and spaces in excess.
#Tokenize and lemmanize
my_doc = nlp(text)
token_list = []
for token in my_doc:
    token_list.append(token.lemma_)

#Remove stopwords and spaces
testo = []
for word in token_list:
    lexeme = nlp.vocab[word]
    if lexeme.is_stop == False:
        if lexeme!="-PRON-":
            if len(word.strip())>1:
                testo.append(word.strip())
Then, I load the ANEW dictionary and converted it into a Python dictionary, where words are the dictionary’s keys. In this way, I can easily access the sentiment value of a certain word.
#Importing and cleaning dictionary
dizionario=[]
with open('ANEW.txt', 'r') as f:
    for i in f:
        dizionario.append(i)
diz_data={}
for i in dizionario[1:]:
    line_sp=i.replace('\n','').strip().split('\t')
    diz_data[line_sp[0]]=list(map(lambda x: 0 if x=="." else float(x), line_sp[2:]))
Algorithm
Now I define the functions that are used to perform sentiment analysis.
The first function is “sent_val”, which takes as arguments a list of words and our sentiment dictionary. The function maps each word of the list to a sentiment score and compute the mean of that score.
The second function is “book_analysis”, which is a function that analyzes a book using the “sent_val” function. It takes as input a pre-processed book, the size of the word window to slide through the text, and the size of overlapping words between different windows. The function proceed to extract pieces of text from the book according to the given parameters and compute the sentiment score for each section.
The last function is “give_perc”, and it simply tells where each word window locates in the book. This is used to compare windows of different lenghts and/or different books.
#Function that map a list of words to sentiment and compute the mean of sentiment
def sent_val(sentences,dizionario):
    mapping = list(filter(None,(list(map(dizionario.get, sentences)))))
    mapping= np.transpose(mapping)
    sentim = mapping[0].mean()
    return sentim

#Function that use the sent_val function to analyze a book, given the window and overlap parameters
def book_analysis(testo,T,overlap):
    N_win=round(len(testo)/(T-overlap)-0.5)
    numerone=[]
    for window in range(N_win):
        t_w=testo[(T-overlap)*window:(T-overlap)*window+T]
        if len(t_w)>0:
            numerone.append(sent_val(t_w,diz_data))
    return numerone

#Function that gives a list of % book completion, given the window and overlap parameters
#Used when plotting the sentiment
def give_perc(testo,T,overlap):
    N_win=round(len(testo)/(T-overlap)-0.5)
    listona=[]
    for i in range(N_win):
        listona.append(i*100/N_win)
    return listona
Results
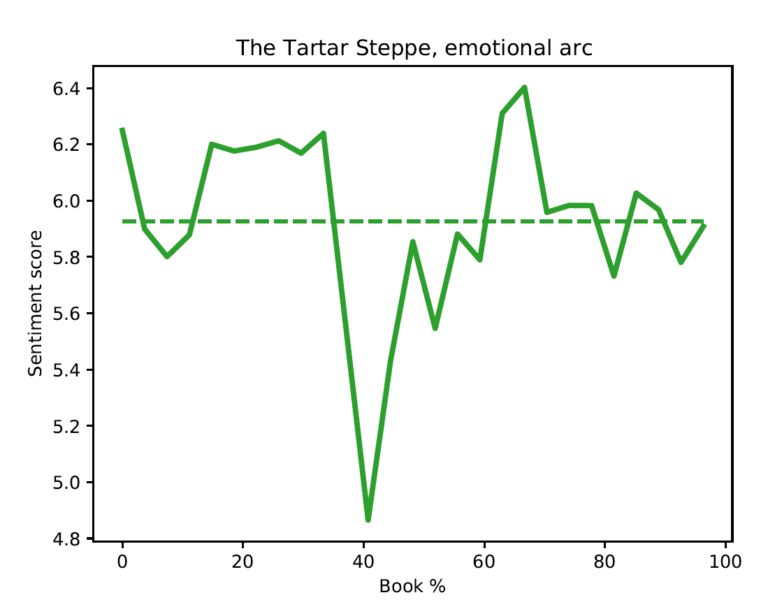
In Figure 1 I plotted the emotional arc of the story, using as parameters T = 1000 and overlap = 100. The mean score of the emotional arc is also plotted. As it is possible to observe, the story starts and concludes on a more or less positive note. However, the central part of the story is very pessimistic, which is reflected with a sharp drop in the emotional score. This kind of arc resembles the so-called “Man in a hole” emotional arc, which is one of the shapes that can be found in Reagan et al. (2016). The “Man in a hole” is characterized by a fall in sentiment and a subsequent rise, and is the opposite of the “Icarus” emotional arc, where we have first a rise and then a fall.
#Parameters
T=1000
overlap=100
#Functions
sent_score=book_analysis(testo,T,overlap)
x=give_perc(testo,T,overlap)
#Compute mean score
mean_score=[]
for i in range(len(sent_score)):
    mean_score.append(sum(sent_score)/len(sent_score))
#plot
%matplotlib notebook
plt.plot(x,sent_score,linewidth=3,label='T= %s' % T,color='tab:green')
plt.plot(x,mean_score,"--",linewidth=2,label='Mean score',color='tab:green')
plt.xlabel('Book %')
plt.ylabel('Sentiment score')
plt.title('The Tartar Steppe, emotional arc')
plt.show()
plt.savefig("plot1.pdf")
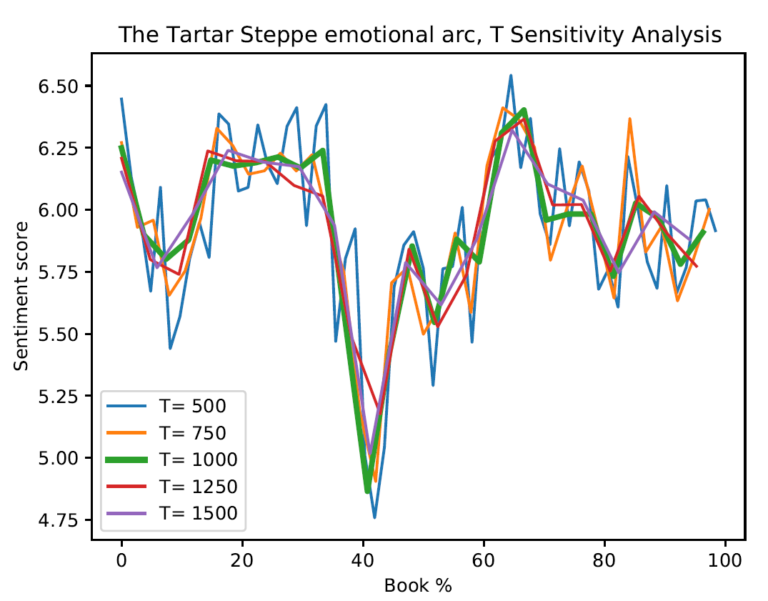
In Figure 2, I performed a sensitivity analysis on the “word window” parameter (T), while leaving the overlap window fixed (= 100). For all of the different lengths, we roughly observe the same pattern. However, for smaller windows, there are larger emotional swings, which tend to be averaged out on wider windows.
#Sensitivity Analysis
#Parameters
T_sens=[500,750,1000,1250,1500]
overlap=100
#plot
%matplotlib notebook
plt.xlabel('Book %')
plt.ylabel('Sentiment score')
plt.title('The Tartar Steppe emotional arc, T Sensitivity Analysis')
for T in T_sens:
    sent_score=book_analysis(testo,T,overlap)
    x=give_perc(testo,T,overlap)
    if T==1000:
        plt.plot(x,sent_score,linewidth=3,label='T= %s' % T)
    else:
        plt.plot(x,sent_score,'-',linewidth=1.5,label='T= %s' % T)
plt.legend()
plt.show()
plt.savefig("plot2.pdf")
One Comment